Marvel Movies

For Marvel Cinematic Universe (MCU) fans, this webpage provides a clear overview of MCU movies across all phases. Users can explore key statistics such as critical ratings, audience scores, release dates, budgets, and box office performance. Whether you're analyzing trends or planning your next movie marathon, this table helps you quickly compare and understand the MCU's cinematic journey.

Table 1. MCU movies with their tomato meter, audience scores, durations, budgets, and box office results.
movie_title mcu_phase release_date tomato_meter audience_score movie_duration production_budget opening_weekend domestic_box_office worldwide_box_office
0 Iron Man 1 5/2/2008 94 91 126 186,000,000 102,118,668 318,604,126 585,171,547
1 The Incredible Hulk 1 6/13/2008 67 70 112 137,500,000 55,414,050 134,806,913 265,573,859
2 Iron Man 2 1 5/7/2010 72 71 124 170,000,000 128,122,480 312,433,331 621,156,389
3 Thor 1 5/6/2011 77 76 113 150,000,000 65,723,338 181,030,624 449,326,618
4 Captain America: The First Avenger 1 7/22/2011 79 75 124 140,000,000 65,058,524 176,654,505 370,569,776
5 The Avengers 1 5/4/2012 91 91 143 225,000,000 207,438,708 623,357,910 1,515,100,211
6 Iron Man 3 2 5/3/2013 79 78 130 200,000,000 174,144,585 408,992,272 1,215,392,272
7 Thor: The Dark World 2 11/8/2013 66 75 111 150,000,000 85,737,841 206,362,140 644,602,516
8 Captain America: The Winter Soldier 2 4/4/2014 90 92 135 170,000,000 95,023,721 259,746,958 714,401,889
9 Guardians of the Galaxy 2 8/1/2014 92 92 121 170,000,000 94,320,883 333,714,112 770,882,395
10 Avengers: Age of Ultron 2 5/1/2015 76 83 141 365,000,000 191,271,109 459,005,868 1,395,316,979
11 Ant-Man 2 7/17/2015 83 85 117 130,000,000 57,225,526 180,202,163 518,858,449
12 Captain America: Civil War 3 5/6/2016 90 89 146 250,000,000 179,139,142 408,084,349 1,151,918,521
13 Doctor Strange 3 11/4/2016 89 86 115 165,000,000 85,058,311 232,641,920 676,354,481
14 Guardians of the Galaxy Vol. 2 3 5/5/2017 85 87 135 200,000,000 146,510,104 389,813,101 869,113,101
15 Spider-Man: Homecoming 3 7/7/2017 92 87 133 175,000,000 117,027,503 334,201,140 878,346,440
16 Thor: Ragnarok 3 11/3/2017 93 87 130 180,000,000 122,744,989 315,058,289 850,482,778
17 Black Panther 3 2/16/2018 96 79 134 200,000,000 202,003,951 700,059,566 1,336,494,321
18 Avengers: Infinity War 3 4/27/2018 85 91 149 300,000,000 257,698,183 678,815,482 2,048,359,754
19 Ant-Man and the Wasp 3 7/6/2018 87 81 118 130,000,000 75,812,205 216,648,740 623,144,660
20 Captain Marvel 3 3/8/2019 79 45 124 175,000,000 153,433,423 426,829,839 1,129,727,388
21 Avengers: End Game 3 4/26/2019 94 90 181 400,000,000 357,115,007 858,373,000 2,797,800,564
22 Spider-Man: Far From Home 3 7/2/2019 90 95 129 160,000,000 92,579,212 390,532,085 1,132,532,832
23 Black Widow 4 7/9/2021 79 91 133 200,000,000 80,366,312 183,651,655 379,751,655
24 Shang-Chi and the Legend of the Ten Rings 4 9/3/2021 91 98 133 150,000,000 75,388,688 224,543,292 432,243,292
25 Eternals 4 11/5/2021 47 78 157 200,000,000 71,297,219 164,870,264 402,064,929
26 Spider-Man: No Way Home 4 12/17/2021 93 98 148 200,000,000 260,138,569 803,975,784 1,891,108,035

Data Analysis

Now let's focus on this specific part of the main data table—all phase 3 MCU movies.

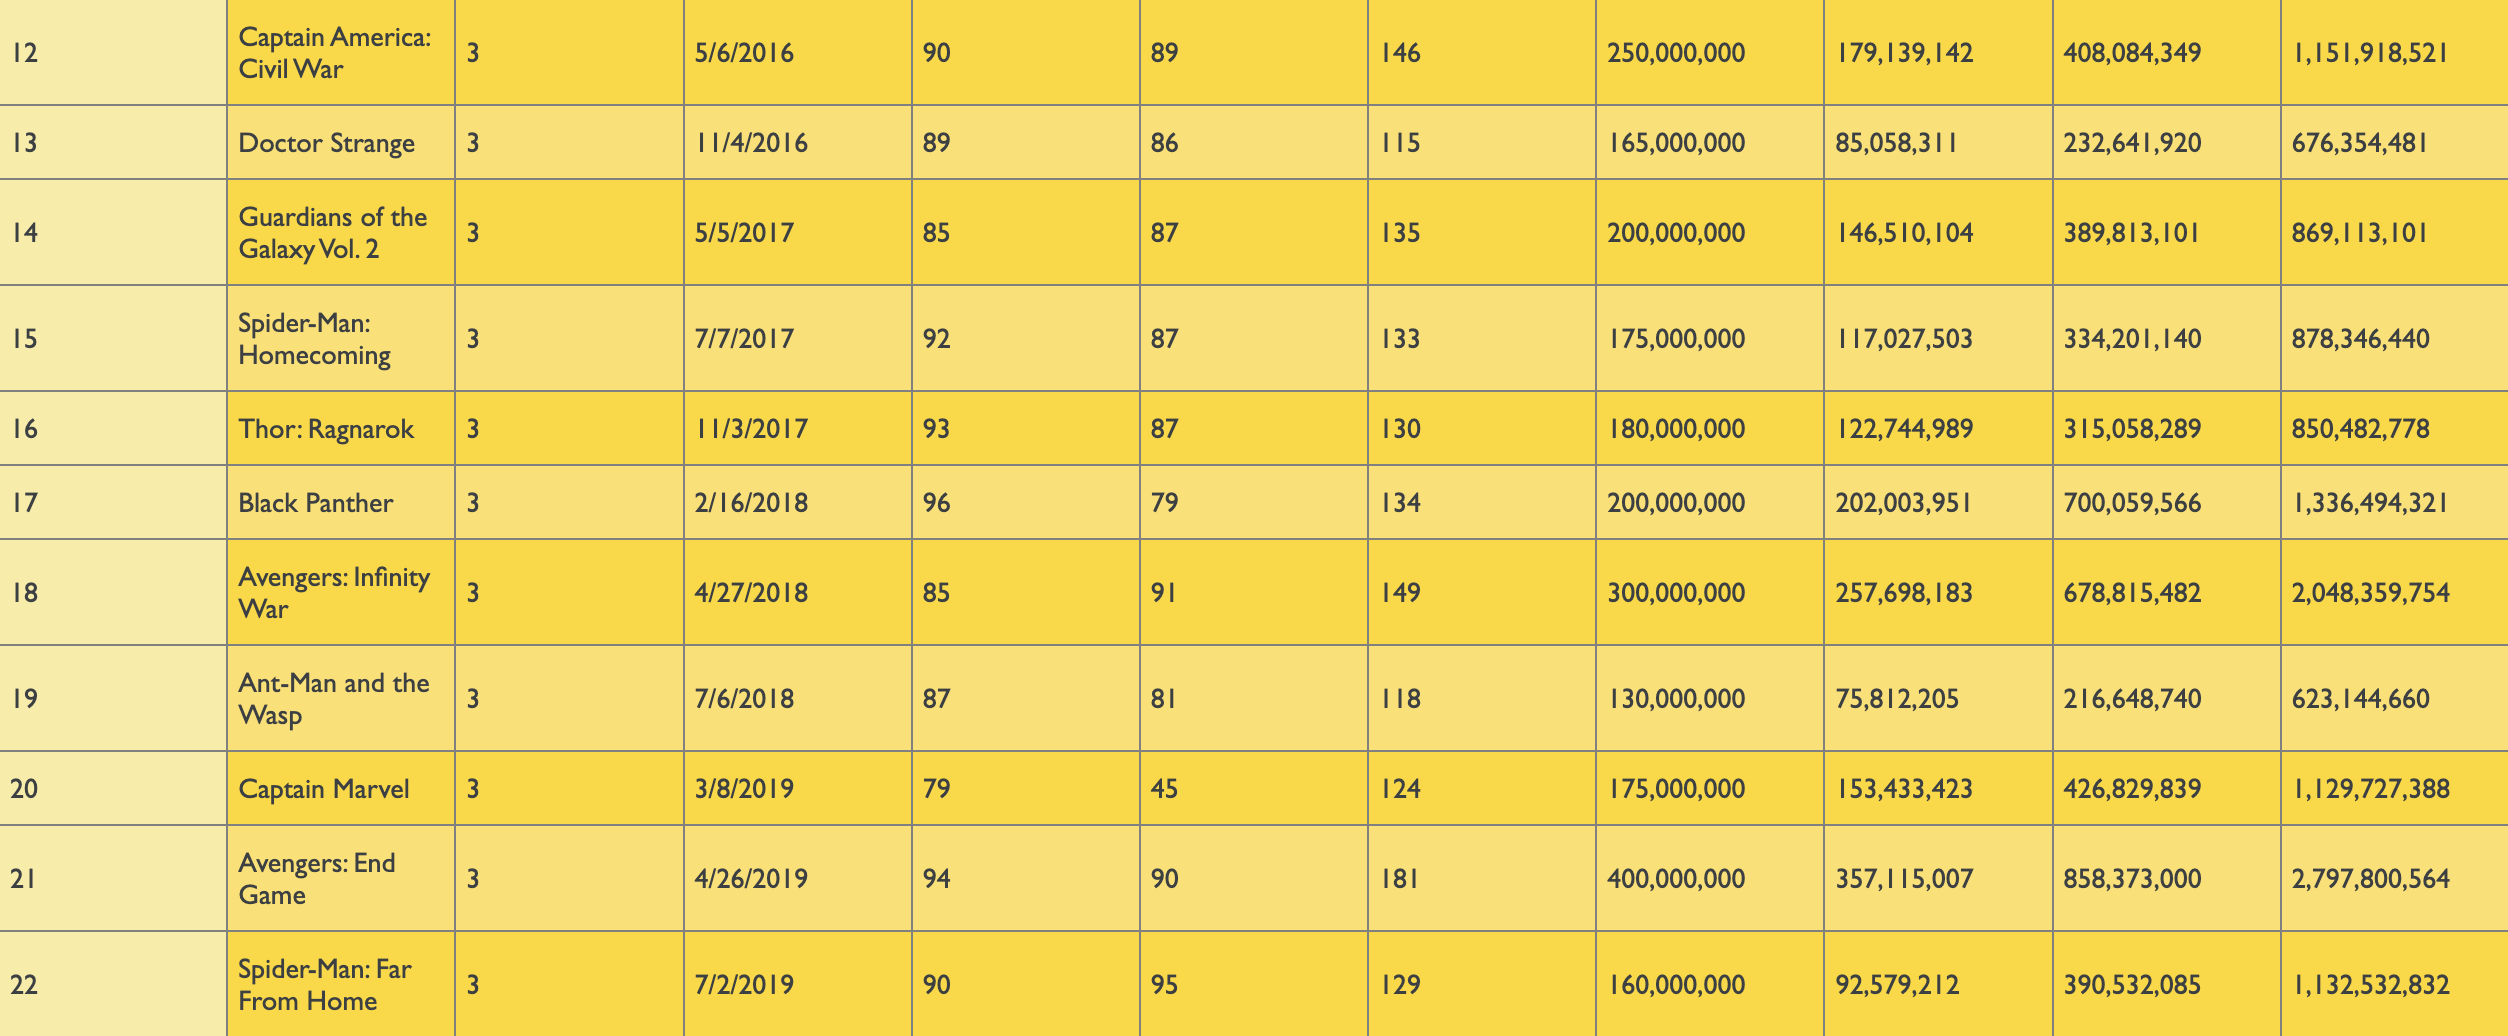
Phase 3 includes some of the MCU's most successful films, with Avengers: End Game achieving the highest record in worldwide box office counts. The tomato meter is a rating system on Rotten Tomatoes that shows the percentage of positive reviews for a movie from professional critics. For phase 3 movies, the overall tomato meter and audience score are high, with only one to two low rating(s) under 80, suggesting phase 3 was both a critical and commercial peak.

Movie Title Worldwide Box Office Tomato Meter
Avengers: End Game $2.79B 94%
Black Panther $1.34B 96%

Best Performers

Both End Game and Black Panther stand out not only for their massive box office totals but also for their high critical gain. This demonstrates that MCU films can achieve commercial success without sacrificing quality.

Glossary

MCU Phase
The official grouping of Marvel Cinematic Universe movies by release era (like phase 1/2/3).
Tomato Meter
Rotten Tomatoes' aggregated critic score in percentage form. Higher values mean a larger range of critics give out positive feedbacks on the movie.
Opening Weekend
The total box office revenue during the film's first weekend in theaters, commonly used as an early indicator of commerical success.
Domestic Box Office
Box office revenue collected within the local market of which the movie is being filmed or produced, reported in USD. For MCU movies as an example, this typically means the United States and Canada.
Worldwide Box Office
The total global box office revenue, also in USD, as an evaluation and impression for overall commercial performance.